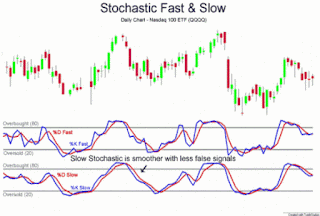
There is a
term such as "Stochastic". He knows absolutely every experienced
trader, and will allow to carry out competent analysis. In general,
"Stochastic" is not used alone, but in conjunction with any other
indicators. This is due to the fact that this indicator too few options,
because of what you may be getting the wrong signals.

If the
"Stochastics" are great options, but the signals will be late. So
oscillator must be used in order to understand the beginning of the movement
and its end. At the same time we should not forget about the area oversold and
overbought. For our work to give more efficiency, are connected to the above
other indicator. Some traders even ispolzute just two stochastic oscillator as
a supplement.
Why
"Stochastic" so popular? Because the strategy is simple to use. For
many years, traders have resorted to this strategy is, and yet all were
satisfied its use in the trade.
This strategy works well on a platform IQ option, on
other platforms, the profitability of the strategy is not guaranteed.
When the
trader uses a combination of two "stochastic", they will have
different settings. If you use the same "Stochastics" no
"profit" we do not receive. This strategy can also be used in such
trading binary options, which are called "all" or "nothing."
In more understandable language for beginners, the «call» and «put».
An analysis
of the market situation carried out by means of graphs. They will be the time
period depicted. Resort to the use of graphics should be mandatory. The main
indicator is called the weak 'stochastic', whose parameters are: 21, 9, 9. From
this we can conclude that a strong "stochastic" (parameters: 9, 3, 3)
is considered optional.
The uptrend

downtrend

Suppose, both
indicators, ie, strong and weak at the same time turned out to be oversold. Let
it be less than 30. In this case, a signal that tells us about the right time
of purchase binary option «call». May newbies will not understand what kind of
signal, and why we need to understand it. Look everything will be clear and
accessible. Blue line begins to cross the weak dotted line. The blue line will
rise from the bottom up, and then stops at a certain position. Once this
happens, we need to expect closing of the candles, because it is because of her
and the signal appeared. Time has passed, the alarm has not disappeared, so we
can start buying the option.
A similar
pattern occurs with the sale of the binary option. Two indicators in overbought
zone (<70) we will create the desired signal. Blue line crosses the red
dotted line downwards. This option tells us that we currently can define the
basic parameters of the market. So, binary options and we will be able to buy
it at a time when it is most advantageous for us. Well, if the blue line
crosses the red, the deal, respectively, will be unprofitable for us.